My latest blog posts have been purely about accessing Census Reporter data. That’s important as a foundation, but now it’s time to bring it all together and see how we can use this resource (and other amazing resources out there such as TileMill and MapBox) to create useful and informative projects.
In this post we’ll take advantage of TileMill and MapBox to create a map of Median Home Value for US Metropolitan Areas (the CBSA Census Geography ).
First, follow steps 1-5 here to boot up an instance of the Census Reporter Database.
Next, follow the post here to connect to PgAdmin.
Download and Install Tilemill.
Create a free MapBox account. (The Sign Up button is in the upper right corner).
Let’s start by creating the geographic data layer that we will use in TileMill. We will be doing this in PgAdmin using the SQL Query tool.
Let’s start by joining the data fields to the census geographic header file.
CREATE TABLE public.CBSA_Pop AS
SELECT tiger2012.cbsa.gid, tiger2012.cbsa.namelsad, tiger2012.cbsa.cbsafp, tiger2012.cbsa.the_geom, acs2012_3yr.geoheader.geoid, acs2012_3yr.geoheader.sumlevel FROM acs2012_3yr.geoheader, tiger2012.cbsa WHERE acs2012_3yr.geoheader.cbsa = tiger2012.cbsa.cbsafp and acs2012_3yr.geoheader.sumlevel=310;
Next we’ll assign the gid field to be the primary key.
ALTER TABLE public.CBSA_Pop ADD PRIMARY KEY (gid);
Now that we have our data, we’ll want to join it to the geography layer.
CREATE TABLE public.CBSA_TileMill2 AS
SELECT public.CBSA_Pop.gid, public.CBSA_Pop.namelsad, public.CBSA_Pop.cbsafp, public.CBSA_Pop.the_geom, public.CBSA_Pop.geoid, acs2012_3yr.seq0155.b25077001 FROM public.CBSA_Pop, acs2012_3yr.seq0155
WHERE public.CBSA_Pop.geoid = acs2012_3yr.seq0155.geoid;
Again, we’ll assign gid to be the primary key
ALTER TABLE public.CBSA_TileMill2 ADD PRIMARY KEY (gid);
Then we’ll add a spatial index to the new layer.
CREATE INDEX geomindex ON public.cbsa_tilemill2 USING GIST ( the_geom );
Data creation finished! Anyone who is familiar with working with Census Data knows that the above step could have taken upwards of 30 minutes normally (if we were using a typical workflow whereby we were downloading through American Fact Finder and joining to our TIGER layers in ArcMap before uploading to our database.) And not that the above SQL was terribly burdensome, but an individual much more skilled in SQL than I am could have done it even more concisely.
Next up; let’s load our data into TileMill and style it.
Open TileMill, and start a new project.
Fill out the project details so that they look something like this:
Now, open your project. You should be looking at an essentially empty map of the world. Let’s add some data! Find the Layers button in the lower left corner. It looks like this:
Click ‘Add Layer’, click on the ‘PostGIS’ button at the top right, and then fill out the dialog as follows:
Your connection string should read:
host=ec2-54-224-74-22.compute-1.amazonaws.com port=5432 user=census password=censuspassword dbname=census
(Of course – don’t copy exactly, substitute your own Amazon Public DNS)
Enter the other values as you’ve seen them above. Don’t worry about copying the SRS string exactly. Just choose WGS84 and everything will populate automagically.
Press Save to return to the map. You can’t see anything because we haven’t styled this layer yet.
Let’s add some CartoCSS to style this layer based upon the Median Home Value (field: b25077001) for each Metro.
#cbsa {
 line-color:#594;
 line-width:0.5;
 polygon-opacity:1;
 polygon-fill:#99FFFF;
 [b25077001 >= 50000] { polygon-fill:#99DDFF; }
 [b25077001 >= 75000] { polygon-fill:#99BBFF; }
 [b25077001 >= 100000] { polygon-fill:#9999FF; }
 [b25077001 >= 125000] { polygon-fill:#9977FF; }
 [b25077001 >= 150000] { polygon-fill:#9955FF; }
 [b25077001 >= 175000] { polygon-fill:#9933FF; }
 [b25077001 >= 200000] { polygon-fill:#9911FF; }
 [b25077001 >= 225000] { polygon-fill:#9900EE; }
 [b25077001 >= 250000] { polygon-fill:#9900CC; }
 [b25077001 >= 275000] { polygon-fill:#9900AA; }
 [b25077001 >= 300000] { polygon-fill:#990088; }
 [b25077001 >= 325000] { polygon-fill:#990066; }
 [b25077001 >= 350000] { polygon-fill:#990044; }
 [b25077001 >= 375000] { polygon-fill:#990022; }
 [b25077001 >= 400000] { polygon-fill:#990000; }
 }
Press the save button in the top right corner. Be patient… TileMill is gathering a lot of data from your cloud database right now. After a short while, the map should be fully loaded:
Fantastic. You can use what you’ve learned to go nuts and add a State Layer if you want. (tiger2012.state) Symbolize it with a black outline (or whatever). I’ll skip this step for brevity.

(You may want to consider uploading the Census cartographic boundary files. Otherwise Michigan looks even more awkward than it already is).
Let’s add a couple more TileMill features.
First up: adding mouseover ability
Click the Templates button. Make sure the ‘Teaser’ tab is selected. Next, look near the bottom of the screen and choose the layer ‘cbsa’.

In the text area, type:
{{{namelsad}}}

Median Value: {{{b25077001}}}
Press Save (in the upper right corner of the TileMill application).
Next, to add the legend.
Click the legend tab, if you haven’t already. I’ve created some code for the legend to save you some time (based off of a MapBox sample that’s been modified).
Median Value (Owner Occupied Housing Units)
- <$50k
- >$400k
Press Save in the upper right corner of TileMill, then exit the Templates screen.
With those easy steps, we’ve now added some much needed extra functionality to our map. The legend is clearly visible in the lower right corner. Also, if you mouse-over a metro area, you’ll see that median home values are shown in a box on the top right corner of the map window.
So uh, we have an extremely slow to load map that is currently confined to our personal computer. Let’s change that.
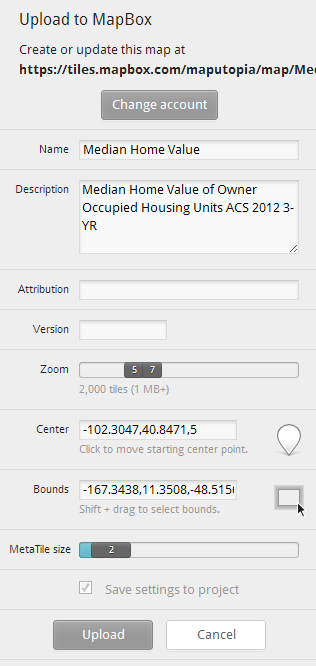
Click the Export button in the upper-right corner of your TileMill application. On the drop down menu, select Upload.
Play around with the extent and the Zoom Levels. (especially the zoom levels) The free version of the MapBox account does have some limits, so you’ll want to keep the size of this project small.
Wait until everything is finished uploading. Then go ahead and press the View button.
Voila!


